


On Monday 14 July 2025, we selected 52 people for the Citizens' Assembly for Culture, which met between September and November 2025, including three online sessions and three face-to-face sessions, to discuss the question:
What would culture and creativity look like in the West of England if they were for everyone?
Working with Citizens in Power, we recruited these 52 people following a two-stage process, in conformity with the OECD's good practice principles for deliberative processes for public decision making.
Stage 1
15,000 mail invitations were sent to households in Bath, North East Somerset, Bristol, North Somerset and South Gloucestershire. These addresses were randomly selected from the Royal Mail database. Each of these addresses received a letter in the post inviting residents to sign up as potential members of the Citizens' Assembly for Culture.
The invitation package consisted of a letter and FAQ, and an invitation card as shown below:
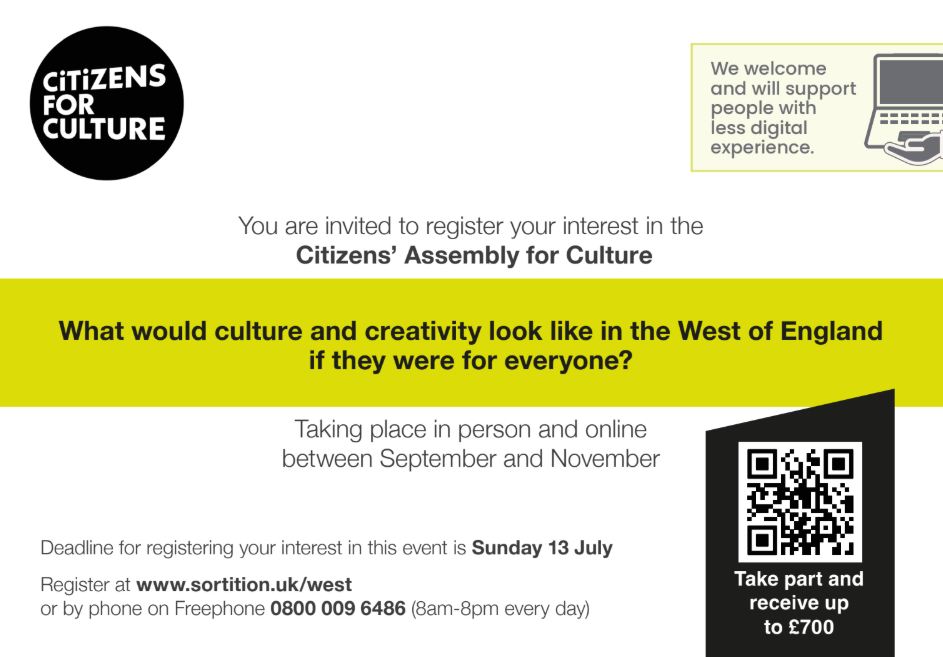
The invitations were open for three weeks, and we received 300 responses.
Stage 2
As part of the sign-up procedure, all potential participants were required to share some information about themselves. We asked them to share their address, their date of birth, their gender identity, their ethnicity, whether they have a disability, and their highest level of education. We also asked if they had attended an arts event, visited a museum or gallery or spent time doing an artistic or creative activity.
We then used this information to perform a democratic lottery. Details of the specific algorithm we use, including information about the fairness of the algorithm, can be found here. During the process of confirming participants, people dropped out and they were replaced by lottery to maintain the demographic make-up of the assembly.
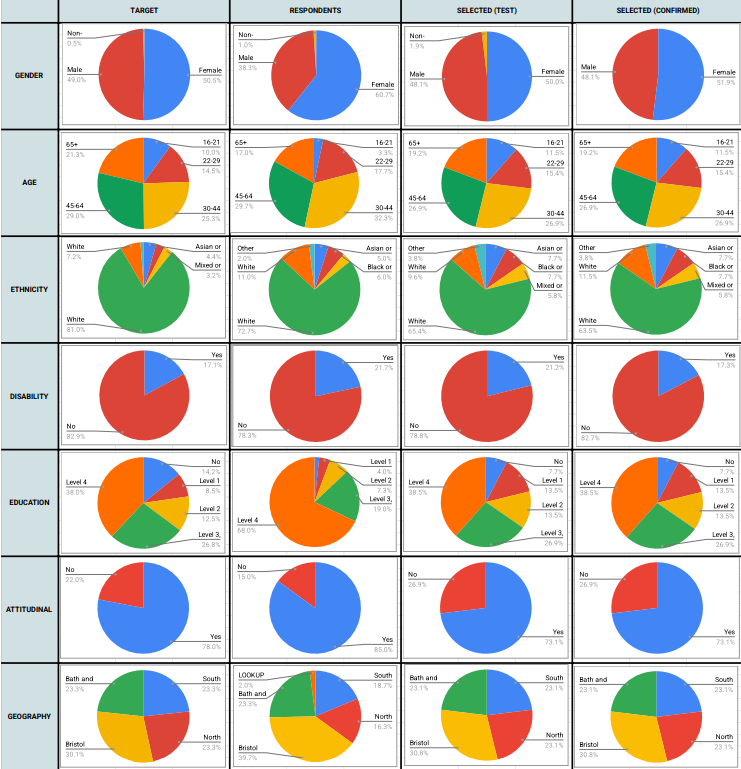
The way to understand these pie charts is as follows:
- Column 1 (Target): These pie charts give information about the population of the area, using various publicly available statistics (via the ONS). As an example, in the second row, you can see that 10% of the population of this area is aged between 16 and 21.
- Column 2 (Respondents): These pie charts summarise the information that was provided to us by the 300 people who signed up as potential participants for the Citizens Assembly for Culture. There is some skewing in statistics here compared with our target: for instance, only 3.3% of respondents were aged between 16 and 21.
-
Column 3 (Originally selected): These pie charts summarise information about the 52 members initially invited to be part of the forum. Notice that, thanks to our use of a sortition algorithm, the pie charts in this column are closer to the target charts in the first column. As part of our recruitment process all of these people were contacted by telephone to confirm that they were still willing and able to participate. Not all people, however, were able to confirm their participation, and some dropped out.
-
Column 4 (Final participants): This final column shows the information relating to the 52 people who confirmed their participation. When people dropped out, we used the sortition algorithm to replace them with others who shared similar characteristics, as far as possible.
What happened next?
The process of the Citizens' Assembly for Culture is being documented on the Citizens for Culture website.